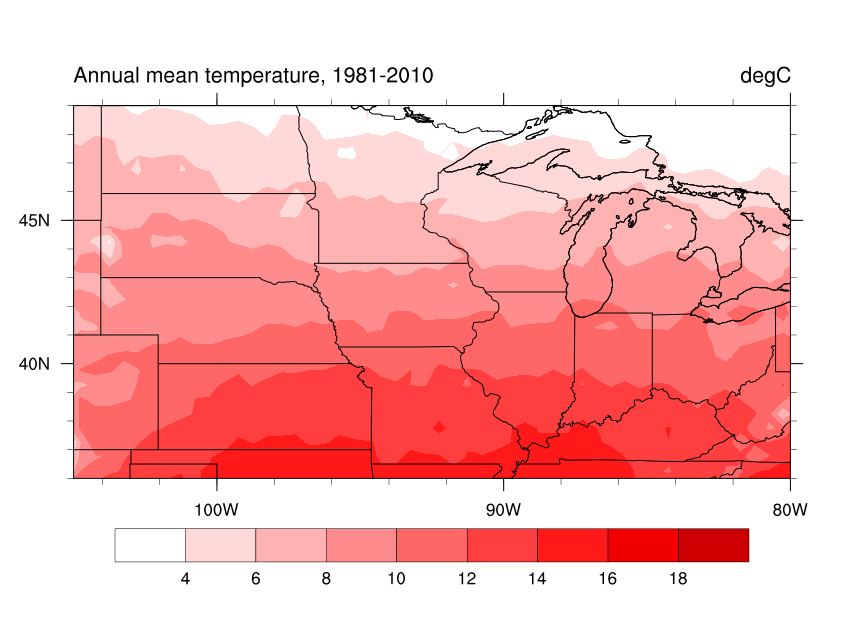
Here are a few graphs that give an idea of the variability of temperature and precipitation over the Corn Belt that may help guide us in establishing spatial detail needed for the farmer survey. These are averages for 1981-2010, which is the current "normal" period for climate statistics.
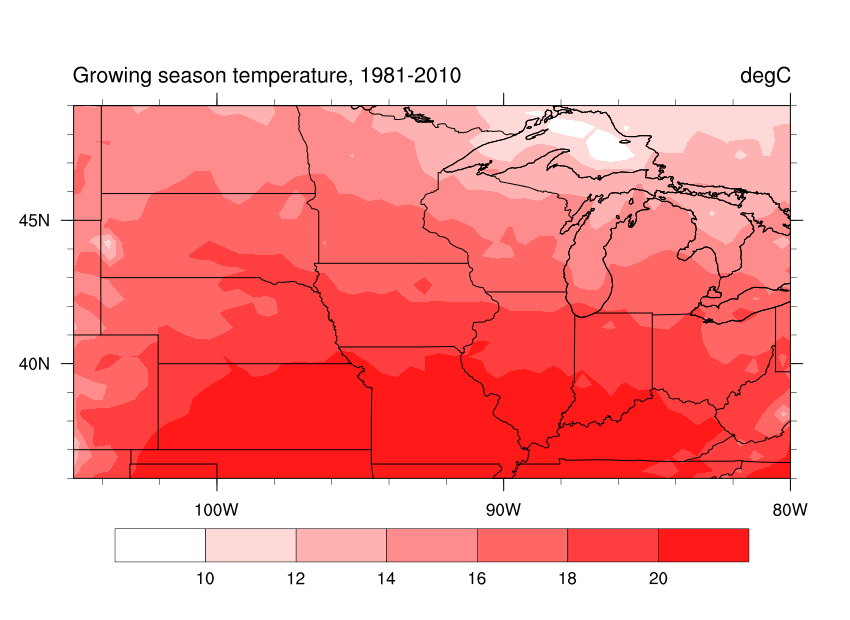
First is annual temperature (left) and growing season temperature (right). "Growing season" is taken
as the period April through September.
These plots show that temperature gradients for both the annual mean and growing season are dominated by latitudinal variations. Therefore if we are looking to combine HUC6 watersheds in a particular region it is better to combine ones that are adjacent to each other in the east-west direction rather than ones that are distributed north to south, at least from the standpoint of temperature.
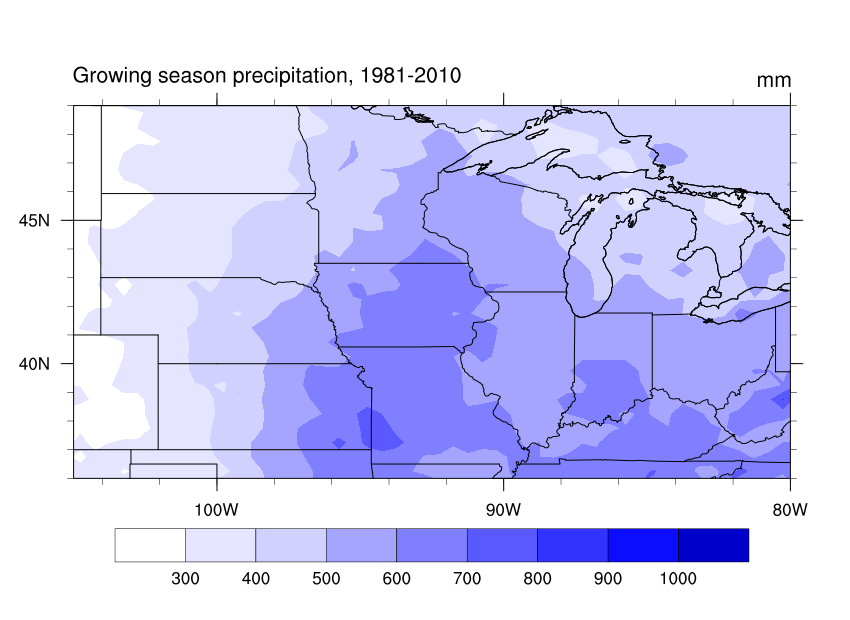
Next we look at annual precipitation (left) and growing season precipitation (right).
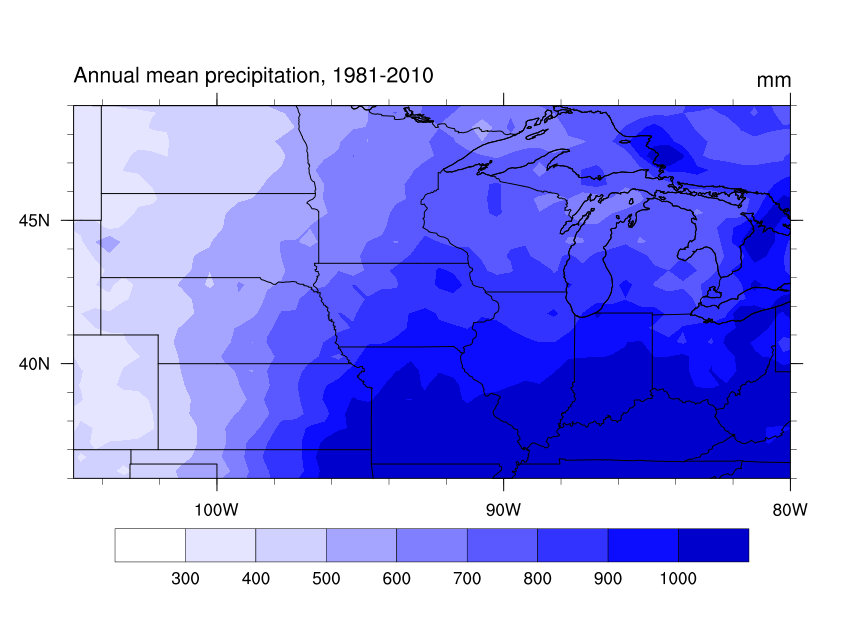
Annual precipitation shows that most of our region is dominated by a north-south gradient similar to that for temperature. West of about 92 degrees longitude (i.e., from abut Iowa City westward) there is a stronger east-west gradient of annual mean precipitation. The western border of our UMRB region is in the western part of Iowa, so only the far western part of our study area will be affected by the east-west precipitation gradient.
The picture is a little more complicated for growing season precipitation. There is a noticeable northward-extending "lobe" (for lack of a better term) for growing season precipitation that stretches from Missouri into Minnesota and Wisconsin. One can certainly imagine that growing season precipitation could affect farmer behavior. Therefore it seems appropriate for us to take this into account.
To summarize:
If you have any questions please feel free to email me.